
Hotline of power engineering specialists
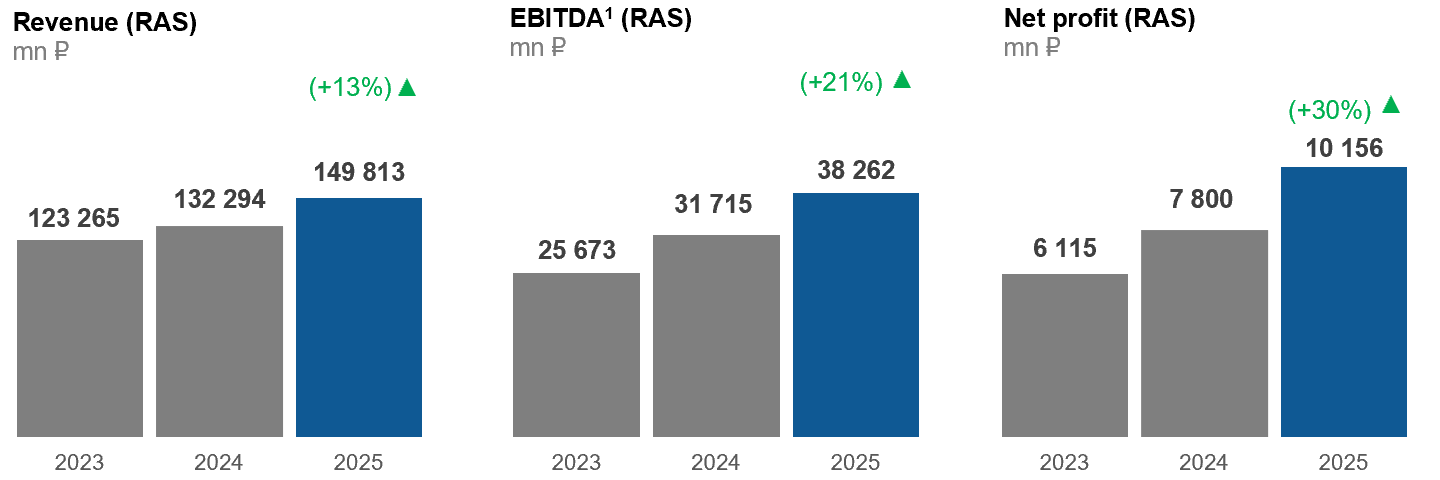
1 EBITDA is calculated as follows: profit before tax + interest payable + depreciation and amortization = l. 2300 f. 2 + l. 2330 f. 2 + l. 6514 f. 2.1+ l. 6554 f. 2.1+ l. 6564 f. 2.1
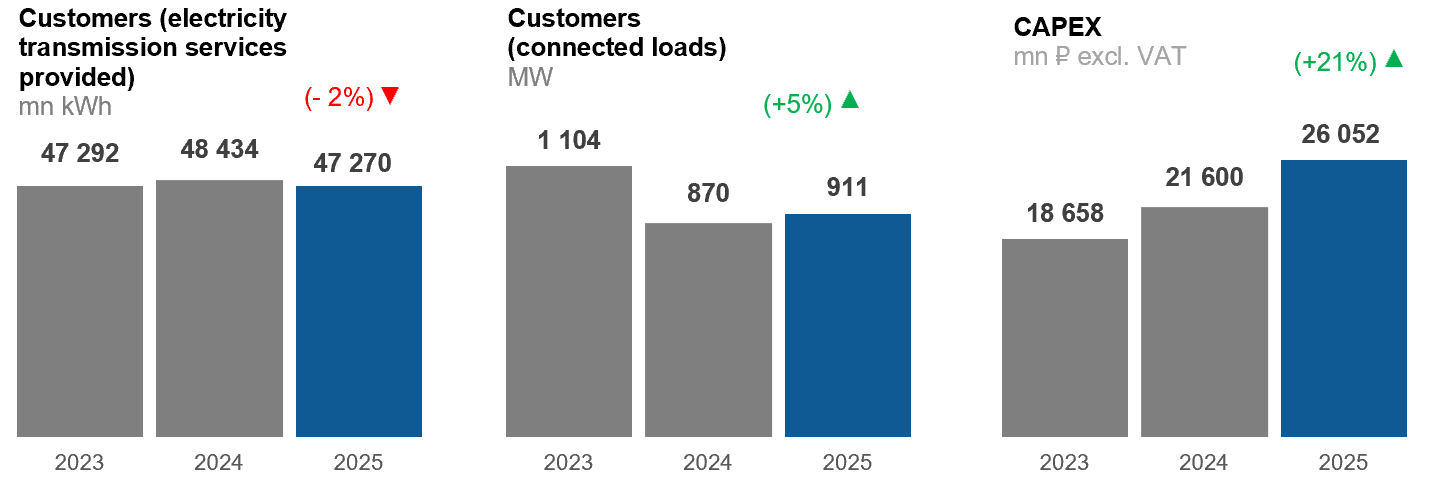
Electric energy transmission* market share
Grid connection market share